books

How to Interpret ANOVA Results Easily and Accurately

29 April 2026
Views (5 views)
How to Interpret ANOVA Results Easily and Accurately

How do I interpret ANOVA results?In the world of quantitative research and statistical data analysis, ANOVA or Analysis of Variance is one of the fundamental tools for examining differences between groups. Whether you are a Master’s level researcher or a PhD student, accurately understanding ANOVA results helps you make scientific decisions based on reliable data.

But once you get the analysis results from a program likeSPSSthe questions begin: what does the F value mean? When is the p-value significant? And how do I present these results in an academic style according to APA guidelines?

In this article, we will guide you step by step to understand and interpret ANOVA results, with practical examples from SPSS, and how to present the results professionally in your scientific research.


What Is ANOVA?

Analysis of Variance (ANOVA) is a statistical test used to compare the means of three or more groups to determine if there are statistically significant differences between them. Unlike the T-test which is used to compare only two groups, ANOVA is more appropriate when you have more than two groups in the independent variable.

ANOVA test analyzes the ‘variance within groups’ versus ‘variance between groups’. If the differences between groups are greater than the differences within each group, this often indicates real differences resulting from the variable being studied.

Basic Types of ANOVA:

  1. One-way ANOVA:
    Used when you have one independent variable (such as type of education: traditional, electronic, blended), and one quantitative dependent variable (such as academic achievement).

  2. Two-way ANOVA:
    Used when you have two independent variables, and the effect of each is studied separately as well as their interaction on the dependent variable.

Simplified practical example:
A researcher wants to study the effect of type of teaching strategy (traditional – electronic – blended) on students’ average scores in a standardized test. Here, One-way ANOVA is used to test whether the performance differences are statistically significant.

✳️ Note:
Although the ANOVA test tells you that there are differences, it does not specify between which groups exactly. Therefore, in some cases, we need to perform an additional test like Tukey to determine where the differences are after ANOVA.


Reading ANOVA Results in SPSS

Once you run the ANOVA test usingSPSS software,you get a results table containing a set of basic statistical values. To understand these results accurately, you need to know the function of each column in the table and how to interpret it.

Here are the main components that appear in the Analysis of Variance (ANOVA) table:

  1. Between Groups
    Represents the variation resulting from differences between different groups in the independent variable. If this variation is large, it indicates potential differences between the means.

  2. Within Groups
    Represents the variation within each subgroup separately. This variation indicates natural differences within the sample.

  3. Total
    Is the total variation (between and within groups).

  4. F-value
    Results from dividing the average variation between groups by the average variation within groups. As the F-value increases, the likelihood of a real difference between groups increases.

  5. Sig. (p-value)
    Indicates the level of statistical significance.

  • If p ≤ 0.05, the result is considered statistically significant, and we reject the null hypothesis.

  • If p > 0.05, there is no statistically significant difference between the means.

Example:
If you get a result: F = 7.84, p = 0.003
This means there is a statistically significant difference between groups at the 0.05 level.

Tip:
Don’t just look at the p-value, but also review the sample size, number of groups, and research context when interpreting results.


Interpreting ANOVA Results

After getting the ANOVA results table fromSPSS,The most important step comes: interpreting the statistical values in a logical and scientific manner. To understand what these results mean, you must focus on three key elements:

  1. Interpreting F-value
    The F-value is the ratio between the variation between groups and the variation within groups.

  • As the F-value increases, the greater the likelihood that there is a real difference between group means.

  • An F-value close to 1 usually means no clear difference.

  1. Interpreting the p-value (Sig.)
    The p-value is used to test the null hypothesis (H₀), which states that “there is no difference between the group means.”

  • If p ≤ 0.05 → we reject the null hypothesis and conclude that there are statistically significant differences.

  • If p > 0.05 → we do not reject the null hypothesis, which means there are no statistically significant differences.

Practical example:
Let’s assume that an ANOVA test gave the following results:

  • F = 5.62

  • df between groups = 2

  • df within groups = 42

  • p = 0.007

Conclusion: There are statistically significant differences between the three groups in the dependent variable, because p < 0.05.

  1. Is ANOVA sufficient to determine the difference?
    No. ANOVA only tells you that there is a difference between the groups, but it doesn’t specify between which ones. Therefore, when the result is statistically significant, we resort to post-hoc tests like Tukey to determine where the difference is.

💡 Tip:
Interpreting ANOVA results is not just about the numbers, but also about the scientific context. You must connect the results with your study objectives and discuss them within the accepted theoretical framework.


After ANOVA: Tukey Test and Subsequent Analyses

After ANOVA results show statistically significant differences between groups, the next step is to determine where these differences are. This is where post-hoc tests come into play, the most famous being Tukey’s test.

  1. What is Tukey’s test?
    Tukey’s HSD (Honestly Significant Difference) is used to compare every pair of groups to determine if the difference between them is statistically significant. This test is characterized by controlling the overall error rate when conducting multiple comparisons.

  2. When do we use Tukey’s test?

  • When we obtain a statistically significant ANOVA result (p ≤ 0.05)

  • When the number of groups ≥ 3

  • When the data distribution is normal and the variance is homogeneous

  1. How to read Tukey test results in SPSS
    After running Post Hoc in SPSS, you will get a table showing:

  • The names of the groups that were compared

  • The difference in means between each pair

  • The probability value (Sig.) for each comparison

  • Is the difference statistically significant?

Example:
If a comparison between “Group A” and “Group B” shows a p-value of 0.003, this means the difference between them is statistically significant.
Whereas if p = 0.198 between “Group B” and “Group C”, there is no significant difference.

  1. Important notes:

  • Tukey is appropriate if the samples are approximately equal.

  • Other tests like Bonferroni or Scheffé can be used depending on the nature of the data.

  • Post Hoc complements ANOVA but does not replace it.

✳️ Summary:
The ANOVA test answers the question: “Is there a difference?”
While the Tukey test answers the question: “Where exactly is the difference?”


Calculating Effect Size After ANOVA:

While the ANOVA test tells you whether the differences between groups are statistically significant (i.e., not due to chance), effect size tells you whether these differences are important practically or educationally.

  1. What is effect size?
    It is a measure used to estimate the “strength” of the relationship between variables or the “degree” of difference between groups.
    Even if the p-value is less than 0.05, a small effect size may mean that the difference is not practically significant.

  2. Most common effect size measures in ANOVA

  • Eta Squared (η²): Shows the percentage of variance in the dependent variable resulting from the independent variable.

  • Partial Eta Squared: Used in two-way or repeated ANOVA.

Common interpretive values for η² (according to Cohen):

  • 0.01 → Small effect size

  • 0.06 → Medium effect

  • 0.14 or more → Large effect

  1. How to calculate effect size in SPSS
    SPSS does not automatically show Eta Squared in traditional ANOVA analysis, but it can be manually calculated as follows:

η² = SS between groups ÷ SS total
(where SS = Sum of Squares)

Example:
If SS between = 150, and SS total = 600
then η² = 150 ÷ 600 = 0.25 → large effect

  1. Importance of including effect size in your study

  • It helps understand the practical value of the results

  • Necessary in applied and educational studies

  • Often required in scientific publishing or when writing a research proposal

💡 Note:
Statistical significance ≠ Practical significance.
Therefore, it is always advisable to report both p and η² or any measure of effect size in ANOVA reports.


How to Write ANOVA Results in Scientific Research According to APA Style

After conducting an ANOVA test and interpreting its results, the final and important step comes: formulating the results in a precise academic style that complies with the scientific publication guide (APA Style). This section explains how to present statistical values and write them in a professional manner that makes it easy for the reader to quickly and clearly understand your results.

  1. Values that must be reported:
    When writing ANOVA results, be sure to include the following:

  • F value

  • Degrees of freedom (df) between groups and within groups

  • Probability value (p-value)

  • Effect size (if possible – such as η²)

  1. Typical phrasing for a results paragraph:
    Here is an example of writing a One-way ANOVA result:

“The results of the one-way analysis of variance showed statistically significant differences between the means of the three groups, F(2, 42) = 5.62, p = .007, η² = .21. This indicates a large effect of teaching method on student achievement.”

  1. APA number formatting:

  • Use two decimal places for F and p (unless p < .001)

  • Do not write “p = 0.000”, write “p < .001”

  • Do not put a zero before the decimal point in p (correct: p = .04)

  1. Notes on documentation:

  • The format of presenting results must match the statistical table included in the research

  • It is preferable to add separate tables showing ANOVA results and Post Hoc table (when needed), with clear headings

  1. Presenting results within the research context:
    Do not just rely on numbers, but link the results to the research question or hypothesis, and explain what they mean within the framework of the study topic.

Illustrative example within a paragraph:
“This result indicates that the type of teaching strategy has a significant effect on student performance, as the group that learned through blended teaching achieved a higher average than the other groups.”


Professional Tips for Accurately Writing ANOVA Results

Formulating ANOVA results is not limited to just listing numbers, but requires accuracy in presentation, and clarity in linking the analysis to the research context. Here are the most important tips that help you present your results professionally:

  1. Link the results to research objectives
    Do not present ANOVA results in isolation. Make sure to link them to your research questions or hypotheses, to show how the results contribute to answering the study’s questions.

  2. Clarify the statistical results and their educational or practical implications

  • Statistical differences may be clear, but they may not have a noticeable practical effect.

  • Therefore, it is important to clarify to the reader whether these differences also have practical significance or not.

  1. Do not neglect effect size

  • Statistical significance alone is not sufficient.

  • Use η² or Partial η² to clarify the strength of the effect, and include it in the report when possible.

  1. Use organized tables to present data

  • Include a table for ANOVA results (containing df, F, p, η²).

  • And if you conducted Post Hoc tests like Tukey, add a separate table showing pairwise comparisons.

  1. Adhere to APA formatting for numbers and symbols

  • Ensure statistical symbols are written correctly: F, p, η²

  • Do not add extra zeros or use Arabic decimal points (for example: write .04 instead of ٠٫٠٤)

  1. Do not interpret the results beyond what they mean

  • Avoid overinterpreting the results or generalizing them beyond the sample scope.

  • Precise scientific interpretation increases the reliability of your study.

  1. Review the language and academic style

  • Make the language direct and clear, free of unnecessary terminology.

  • Ask your supervisor or academic office to review the results linguistically and methodologically if needed.

💡 Tip:
The more your results are formulated in a disciplined scientific style, the greater the chances of your study being accepted in peer-reviewed journals or included in graduate research projects.


The Role of Academic Offices in Analyzing and Writing ANOVA Results

For many researchers, the statistical analysis and results writing phase presents a real challenge. Dealing with SPSS software, understanding its outputs, and then converting them into paragraphs written in an academic style requires technical skill and precise research experience. This is where specialized academic offices come in, offering professional services for analyzing and writing ANOVA results.

  1. When Do You Need a Specialized Office?

  • When you are not proficient in using statistical analysis software like SPSS

  • If you are unable to interpret ANOVA results (F value, p value, effect size…)

  • When you need to write the results in the approved APA format

  • If you are committed to a final deadline and don’t have time to learn analysis from scratch

  1. How Do Academic Offices Help You?

  • Performing complete statistical analysis of the data

  • Interpreting and explaining the results in a simplified way

  • Calculating effect size and integrating it into the report

  • Formatting the results according to the APA guide (or your university’s specific guide)

  • Preparing the required tables and graphs

  • Reviewing the results and ensuring their accuracy and freedom from errors

  1. خدمات "دراسة الأفكار للبحث والتطوير" في التحليل الإحصائي

At Study Ideas Company, we offer comprehensive solutions for analyzing ANOVA results, starting from receiving the database (Excel or SPSS), to preparing written results ready to be included in the research or academic paper.

🔹 Why Do Researchers Trust Us?

  • A specialized team of statistical analysts and academics

  • Custom results writing service based on study type (educational, medical, administrative…)

  • Delivery of results in Word and PDF formats

  • Free revision until final acceptance

  • Full confidentiality guarantee for data and content

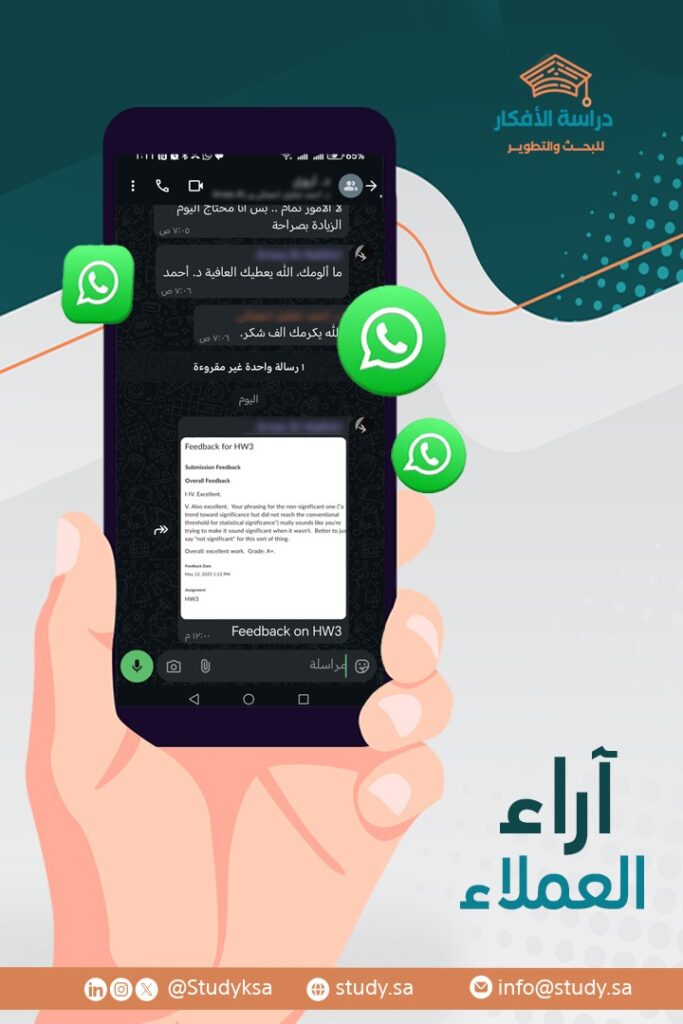
🗣️ Customer Feedback: Real Experiences With Professional Results

We at ‘Study Ideas for Research and Development’ take pride in the trust of researchers and students from various disciplines who have relied on us for professional ANOVA analysis and writing. Here are some of their testimonials:

ثقة العملاء هي أعظم إنجازاتنا – رأي عميل يعكس جودة العمل والاحترافية نفتخر بآرائكم – إنجاز يُقاس برضاكم

Conclusion:

ANOVA testing is not just a technical statistical procedure, but a vital tool used to discover differences between groups and enrich research results with strong scientific significance. However, the value of this analysis is not complete without accurate interpretation and clear writing that adheres to the approved methodology and academic style.

Through this guide, you will be able to:

  • Understand the meaning of statistical values such as F, p, and η²,

  • Interpret SPSS outputs with confidence,

  • And present your results in your research in a scientific format that complies with APA standards.

Whether you are writing a graduation thesis, master’s thesis, or doctoral dissertation, paying attention to the results phase demonstrates your seriousness as a researcher and reflects your ability to logically connect data and conclusions in a scientific manner.

✳️ Do You Need Support in ANOVA Analysis or Writing Results?

We at Study Ideas for Research and Development offer you:

  • Comprehensive statistical analysis using SPSS

  • ANOVA results writing according to your university’s guidelines and in APA format

  • Free scientific and linguistic review

  • Previous samples for review

  • Continuous support until your research is officially approved

📞To contact us directly via WhatsApp

Let us help you present accurate, reliable, and professionally written statistical results that reflect the quality of your academic work.

الموقع الأول في المملكة العربية السعودية للخدمات الأكاديمية

Comments

Explore Our Services
11111
Professional Jamovi Data Analysis Services for Students & Researchers
icon
Professional Jamovi Data Analysis Services for Students & Researchers
11111
خدمة تحليل البيانات باستخدام برنامج JASP
icon
خدمة تحليل البيانات باستخدام برنامج JASP
11111
خدمة التحليل الإحصائي النوعي
icon
خدمة التحليل الإحصائي النوعي
11111
خدمة التحليل المختلط بمنهجية Q
icon
خدمة التحليل المختلط بمنهجية Q
11111
خدمة التحليل الإحصائي بلغة R
icon
خدمة التحليل الإحصائي بلغة R
11111
خدمة التحليل الإحصائي ببرنامج E-Views
icon
خدمة التحليل الإحصائي ببرنامج E-Views
11111
خدمة التحليل الإحصائي المتقدم بـ AMOS
icon
خدمة التحليل الإحصائي المتقدم بـ AMOS
11111
خدمة تصور البيانات (Data Visualization) وإنشاء تقارير تفاعلية
icon
خدمة تصور البيانات (Data Visualization) وإنشاء تقارير تفاعلية
11111
خدمة تصميم العروض التقديمية للمناقشة
icon
خدمة تصميم العروض التقديمية للمناقشة
11111
خدمة الباحث المشارك (Co-Researcher Service)
icon
خدمة الباحث المشارك (Co-Researcher Service)
11111
خدمة عمل كتاب إلكتروني وفق المعايير الأكاديمية
icon
خدمة عمل كتاب إلكتروني وفق المعايير الأكاديمية
11111
خدمة كتابة ملخص البحث وترجمته للإنجليزية
icon
خدمة كتابة ملخص البحث وترجمته للإنجليزية
11111
خدمة تلخيص الكتب والمراجع العربية والإنجليزية
icon
خدمة تلخيص الكتب والمراجع العربية والإنجليزية
11111
خدمة تصميم البوسترات البحثية الاحترافية
icon
خدمة تصميم البوسترات البحثية الاحترافية
11111
خدمة ترشيح المجلات العلمية المحكمة
icon
خدمة ترشيح المجلات العلمية المحكمة
Get a free consultation from experts
whatsapp