books

T-test usage: When to Use a T-Test: Key Guide for Statistical

29 April 2026
Views (5 views)
T-test usage: When to Use a T-Test: Key Guide for Statistical

When should I use a T-Test?T-Test is one of the most common statistical tests in academic research, especially in studies that aim to compare the means of two groups. Whether you are a Master’s researcher or a student in graduation projects, you will definitely need to conduct a T-test at some point, but the important question is: when should you use it? And is it the appropriate test for your data?

In this article, we provide you with a simplified and practical guide to understanding T-Test, its types, conditions for use, and practical examples that help you make the right decision when analyzing your data. We also clarify the difference between T-Test andANOVA, how to write results in APA style, along with highlighting the academic assistance services available to researchers.


What Is a T-test?

T-Test is one of the statistical tests used to compare the means of two groups, with the aim of determining whether the difference between them is statistically significant, i.e., not due to chance. It is one of the most common tests in scientific research, especially in studies that include two groups of participants, or compare the performance of the same group in two different conditions.

The purpose of the T-test is to test the null hypothesis, which usually states that “there is no difference” between the two groups. If the test result shows a statistically significant difference, the null hypothesis is rejected, which means that the independent variable may have actually affected the results.

Examples of Its Use:

  1. Comparing the average scores of students in two different schools

  2. Measuring the effect of a training program on employee performance before and after training

  3. Testing whether sleep duration affects concentration level

T-Test is the cornerstone of many educational, psychological, and social studies. However, it is not used randomly; certain conditions must be met before applying it, which we will discuss later.


When Do We Use T-test in Scientific Research?

T-Test is not used in all studies that involve comparison, but it suits specific cases where certain statistical conditions apply. Here are the main cases where it is recommended to use T-Test:

  1. When comparing only two means
    T-Test is used when you have a quantitative dependent variable (such as scores, time, rate), and a binary independent variable (such as male/female, before/after, experimental/control group).

  2. When you want to know if the difference between the two groups is real
    T-Test helps determine whether the difference in means between two groups reflects a real effect or is due to chance.

  3. When the sample size is small to medium
    T-Test is suitable when working with limited research samples (usually less than 30 participants in each group), unlike some other tests that require large sizes.

  4. Common application examples:

  • Comparing the academic achievement of students who learned by traditional methods versus a group that used e-learning.

  • Testing the extent of blood pressure difference between males and females.

  • Examining the effect of a food product before and after consuming it for a week.

💡 Tip:
If you have three or more groups, using ANOVA will be more appropriate than T-Test.


Types of T-test With Examples

T-Test is not limited to one type, but branches into three main types, each used according to the nature of the data and study design. Understanding these types is essential to applyStatistical Analysiscorrectly and interpret its results accurately.

  1. One-Sample T-Test
    Used to compare the mean of a single sample with a known standard value (such as a national average or expected number).
    Example:
    Does the average score of fourth-grade students in your school differ from the national average (which is assumed to be 75)?

  2. Independent Samples T-Test
    Used to compare the means of two independent groups.
    Example:
    Comparing the average customer satisfaction between two branches of a specific restaurant in two different cities.
    Group One: Customers of the first branch
    Group Two: Customers of the second branch

  3. Paired Samples T-Test
    Used when the two samples are related, meaning the same individuals were measured twice (for example, before and after).
    Example:
    Measuring students’ achievement before and after using a new teaching strategy.
    (Same students – same variable – different times)

Illustrative Table:

نوع T-Test حالة الاستخدام هل المجموعات مستقلة؟
One-Sample مقارنة مع قيمة ثابتة لا ينطبق
Independent Samples مقارنة مجموعتين مختلفتين نعم
Paired Samples قياسات مكررة لنفس العينة لا (مرتبطة)

📝 Note:
Choosing the correct type of T-Test depends primarily on the study design and the nature of the data, so make sure you understand the difference well before applying the analysis.

T-test Usage Conditions

For the T-Test to be appropriate and produce accurate results, several essential conditions must be met. Ignoring these conditions may lead to incorrect or misleading conclusions in scientific research. Below are the most important conditions that should be verified before using the T-Test:

  1. Data Type:

  • The dependent variable must be quantitative (continuous), such as scores, weight, time, or rates.

  • T-Test is not used with nominal or ordinal data.

  1. Normal Distribution:

  • The data in each group should be approximately normally distributed.

  • This can be verified using the Shapiro-Wilk test or through graphical methods (such as a Histogram).

  1. Homogeneity of Variance:

  • In an independent samples T-Test, the variances of the two groups should be similar.

  • This condition can be checked using Levene’s Test.

  1. Independence of Observations:

  • In an independent samples T-Test, there should be no repetition or correlation between the data of individuals in the two groups.

  • In a paired samples T-Test, however, the relationship is necessary.

  1. Appropriate Sample Size:

  • Although T-Test is often used with small samples, having an adequate sample size for each group (such as n ≥ 15) enhances the power of the analysis.

💡 Note:
If some of these conditions are not met, you may need to use alternative non-parametric tests such as Mann-Whitney or Wilcoxon.

✳️ Would you like to verify your data conditions before performing a T-Test? Contact the statistical analysis team at “Study Ideas” to get a professional review of your data before starting.


Difference Between Independent and Paired T-test

Understanding the difference between Independent Samples T-Test and Paired Samples T-Test is essential for determining the appropriate type of analysis for your study. Although both share the same goal – comparing means – each has completely different use cases.

  1. Independent Samples T-test

  • Used when comparing the means of two completely different groups.

  • There is no correlation or relationship between individuals in the two groups.

  • Common examples:
    • Comparing student achievement from two different schools
    • Comparing customer satisfaction between two separate companies
    • Comparing anxiety levels between males and females

  1. Paired Samples T-test

  • Used when data is collected from the same people at two different time periods, or when there is a direct relationship between the samples.

  • Also known as “Paired T-Test” or “Repeated Measures”.

  • Common examples:
    • Measuring employee performance before and after training
    • Comparing blood pressure for the same group before and after treatment
    • Measuring the effect of a new product on the same group

Simplified Comparison Table:

المقارنة T-Test المستقل T-Test المرتبط
نوع العينات عينتان منفصلتان نفس العينة (مرتين)
العلاقة بين المجموعتين لا يوجد موجودة
مثال ذكور vs إناث قبل vs بعد

💡 How to Choose?

  • If you are comparing two separate groups of participants → use Independent T

  • If you are comparing results of the same individuals at two stages → use Paired T

✳️ Note:
Choosing the correct type of T-Test affects not only the accuracy of the analysis, but also prevents you from making a false rejection or an unwarranted acceptance of the hypothesis.


Examples of Using T-test in SPSS

SPSS is one of the most commonly used tools in statisticaldata analysis, and it provides a visual interface that helps researchers perform T-Tests easily and accurately, without the need for programming or complex equations.

Here are the steps to apply T-Test in SPSS with real examples for each type:

  1. T-test for Two Independent Samples (independent Samples T-test)

Example:
Does the average academic achievement differ between males and females?

Application Steps:

  • Open the data file (must contain a quantitative variable like “Achievement” and a binary categorical variable like “Gender”).

  • From the top menu select: Analyze ← Compare Means ← Independent-Samples T Test

  • Enter the dependent variable in the Test Variable box

  • Enter the independent variable in the Grouping Variable box ← specify the codes for the two groups (e.g., 1=Male, 2=Female)

  • Click OK

The Results Will Appear in the Output Window and Include:

  • Difference in means

  • t value

  • degrees of freedom df

  • Significance probability (Sig. 2-tailed)

  1. Paired Samples T-test

Example:
Is there a difference in students’ scores before and after a training course?

Application Steps:

  • Ensure there are two columns in the data file (e.g., score before, score after)

  • From the top menu select: Analyze ← Compare Means ← Paired-Samples T Test

  • Enter both variables in the Paired Variables box

  • Click OK

The Results Include:

  • Mean difference between the measures

  • calculated t value

  • df

  • p significance value

  1. One-sample T-test

Example:
Does the average sleep hours of a student sample differ from the reference value of 8 hours?

Steps:

  • Select: Analyze ← Compare Means ← One-Sample T Test

  • Enter the variable (sleep hours)

  • Specify the reference value (e.g., 8)

  • Click OK

The result shows whether the sample mean differs significantly from the specified value.

💡 Note:
All these tests come with ready-made tables in SPSS, and only need to be interpreted and written in a scientific style, which we will cover in the next section.


How to Interpret T-test Results With the P-value

After performing a T-Test in SPSS or any other statistical program, outputs appear that include several values, the most important of which are:

  1. Means of the two groups

  2. Mean Difference

  3. T-statistic value (t)

  4. Degrees of freedom (df)

  5. Probability value (Sig. or p-value)

To understand these results and use them in writing an accurate scientific report, here’s how to interpret each element:

  1. T-Statistic value
    It is the calculated value based on the difference between the means compared to the variance within the groups. The larger the T value (negative or positive), the greater the likelihood that the difference between the two groups is not due to chance.

  2. Degrees of freedom df
    Depend on the number of participants in each group. They are used to determine the reference table for the T value.

  3. Probability value (p-value)
    It is the decisive factor in making a decision about the null hypothesis.

  • If p ≤ 0.05 → The difference between the two groups is statistically significant

  • If p > 0.05 → There is no significant difference between the two groups

Practical example:
If the SPSS result is:
t(38) = 2.41, p = 0.021
This means that the difference between the two groups is statistically significant (because p is less than 0.05), and we can reject the null hypothesis.

  1. Interpreting the result in the research context
    Don’t just focus on the numbers, but connect them to your research question. For example:
    “The results of the T-test indicate a statistically significant difference between the mean achievement of students in the two groups, with the group that underwent electronic training performing better.”

💡 Note:
Statistical significance doesn’t always mean the difference is large or practically important, so it’s better to also calculate the “Effect Size”, which we will discuss later in the following paragraphs.


When Should I Use T-test Instead of ANOVA?

A common question among researchers: Should I use a T-Test or do I need to use Analysis of Variance (ANOVA)? The answer depends on the study design and the number of groups you want to compare.

  1. Use T-test When:

  • You are comparing only two groups (independent or related).

  • The dependent variable is quantitative and the independent variable is binary (e.g., male/female, before/after).

  • There is no need to compare more than two groups at the same time.

  • You don’t want to examine the interaction between more than one independent variable.

Example:
Comparing the average scores of students from only two classes → T-Test

  1. Use ANOVA When:

  • You have three or more groups.

  • You want to examine the effect of more than one independent variable at the same time (e.g., gender and type of education).

  • You need to analyze the differences between groups and their interactions.

Example:
Comparing the average achievement among three different teaching methods → ANOVA

  1. Why don’t we use T-Test multiple times instead of ANOVA?
    Because repeating a T-test for multiple groups increases the likelihood of Type I Error, which reduces the credibility of the results. ANOVA was designed to handle this type of analysis in a scientifically sound manner.

💡 Important tip:
If you get a significant result in ANOVA, you will need post-hoc tests (like Tukey) to find the differences between each pair of groups. In a T-Test, the comparison is directly between only two groups.

✳️ Still unsure about the most appropriate test for your data? The statistical analysis team at ‘Idea Study’ provides customized consultations to professionally identify and analyze the correct type.


Writing T-test Results in APA Style

After conducting a T-test and extracting the results, the final and important step in research is to present these results in a scientific and accurate format according to the APA (American Psychological Association) formatting guide. Adhering to this style not only reflects professionalism but also makes it easier for the review committee or readers to understand and trust your results.

  1. What to Include When Writing T-test Results:

  • Type of test used (independent, paired, one-sample)

  • Statistical t value

  • Degrees of freedom (df)

  • Probability value (p-value)

  • (Optional) Effect size if present (e.g., Cohen’s d)

  1. Standard Phrasing According to APA:

  • For one sample:
    “The mean score (M = 82.5, SD = 7.3) was significantly higher than the benchmark value of 75, t(29) = 3.14, p = .004.”

  • For two independent samples:
    “There was a significant difference in scores between the experimental group (M = 85.2, SD = 6.8) and the control group (M = 79.6, SD = 7.5), t(58) = 2.52, p = .014.”

  • For two paired samples:
    “A paired samples t-test showed a significant increase in performance from pre-test (M = 72.4, SD = 5.6) to post-test (M = 78.9, SD = 6.2), t(24) = 4.76, p < .001.”

  1. Important Formatting:

  • Use two decimal places for t and p (unless p < .001)

  • Do not write p = 0.000 but write p < .001

  • Use correct Latin characters such as: t, M, SD, p

  1. Presenting Results in Text Versus Table:

  • It is preferable to include a table in the results section to display detailed statistics (mean, standard deviation, t, df, p)

  • Then use a descriptive paragraph in the text to explain the main results in understandable language

💡 Note:
If your goal is to publish in a peer-reviewed scientific journal, ensure that the wording complies with the journal’s guide, which is often based on APA.


Common Errors in Using T-test

Despite the ease of applying T-Test compared to other statistical analyses, many researchers fall into methodological errors that affect the accuracy of results or lead to misleading conclusions. Here are the most common of these errors and how to avoid them:

  1. Choosing an Inappropriate Type of T-test

  • Error: Using T for two independent samples in the case of two related samples (or vice versa).

  • Solution: Ensure the design of your study. If the data is taken from the same people (before/after), use paired T. If from two different groups, use independent T.

  1. Ignoring the Normality Condition

  • Error: Applying T-Test without ensuring that the data is normally distributed, especially in small samples.

  • Solution: Use tests like Shapiro-Wilk or graphs to evaluate the distribution.

  1. Neglecting to Check for Homogeneity of Variance

  • Error: Assuming that the variance of the two groups is equal without testing it.

  • Solution: Use Levene’s Test to assess homogeneity of variance when using independent T.

  1. Over-reliance on P-value Only

  • Error: Interpreting results based on p without looking at effect size or practical benefit.

  • Solution: Calculate effect size measures (like Cohen’s d) to clarify the importance of the differences.

  1. Using T-test to Compare More Than Two Groups

  • Error: Performing multiple T-tests on three or more groups, which increases the probability of statistical error.

  • Solution: Use ANOVA when you have three or more groups.

  1. Not Documenting the Analysis Method Clearly

  • Error: Presenting results without referring to the type of test or the characteristics of the data used.

  • Solution: Be sure to mention the name of the test, number of participants, baseline values (M, SD, t, df, p) in the wording of the results.

💡 Methodological tip:
Always review your statistical analysis steps with your supervisor or statistical advisor before including the final results in your scientific paper.

✳️ The statistical analysis service in ‘Study Ideas’ reviews your data step by step, ensures the correct type of T-Test is applied, and interprets the results accurately according to your academic field.


Statistical Assistance Services from the Best Research Writing Offices

Often, researchers face difficulties in choosing the appropriate statistical test method or interpreting the results in a precise academic manner, especially in the final stages of preparing scientific theses. This is where specialized offices play a role, offering professional services for analyzing and writing statistical results, including the ‘Study Ideas for Research and Development’ office.

Why Do You Need Professional Support When Analyzing T-test Data?

  1. To avoid common methodological errors such as using an inappropriate type of T-Test or ignoring statistical conditions.

  2. To ensure correct interpretation of statistical values (t, p, df, Cohen’s d…) and link them to your research question.

  3. To write the results according to APA guidelines or your university’s academic guide.

  4. To save time and avoid repeated revisions from your supervisor or examination committee.

What Does ‘study Ideas’ Offer You in This Regard?

✅ Complete analysis of T-Test data using SPSS or approved software.
✅ Review of your data and determination of the most appropriate test type for your research case (independent, paired, one sample).
✅ Detailed interpretation of results in simple scientific language supported by tables and graphs.
✅ Writing results in APA style with linguistic and methodological proofreading.
✅ Continuous support until the results are approved by your supervisor or academic committee.

خدمات "دراسة الأفكار للبحث والتطوير" في التحليل الإحصائي

Opinions from Some of Our Clients:

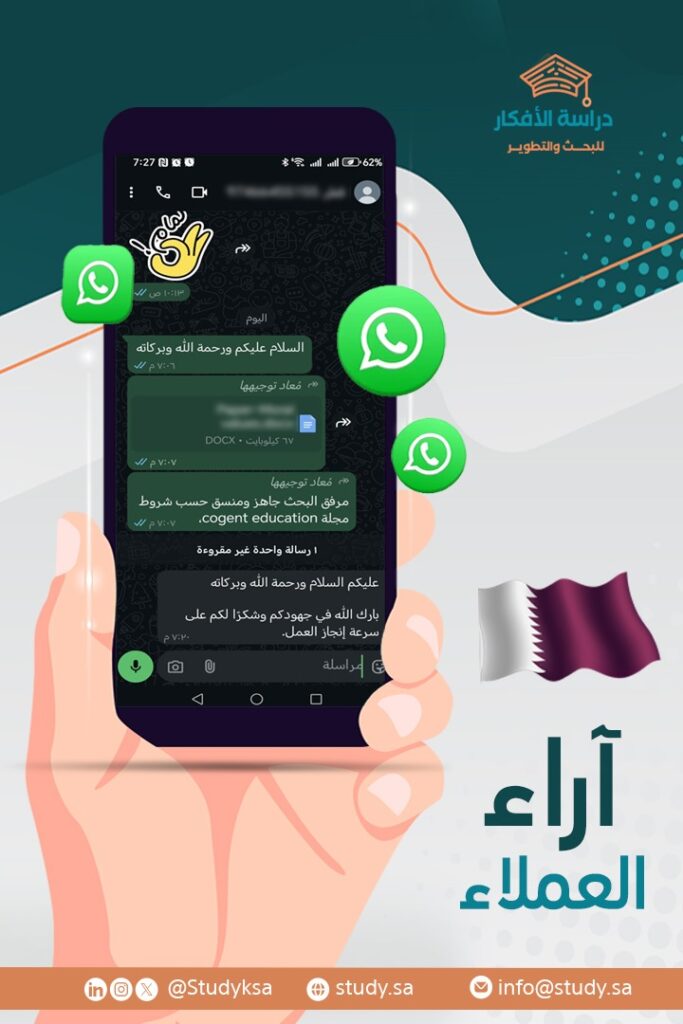
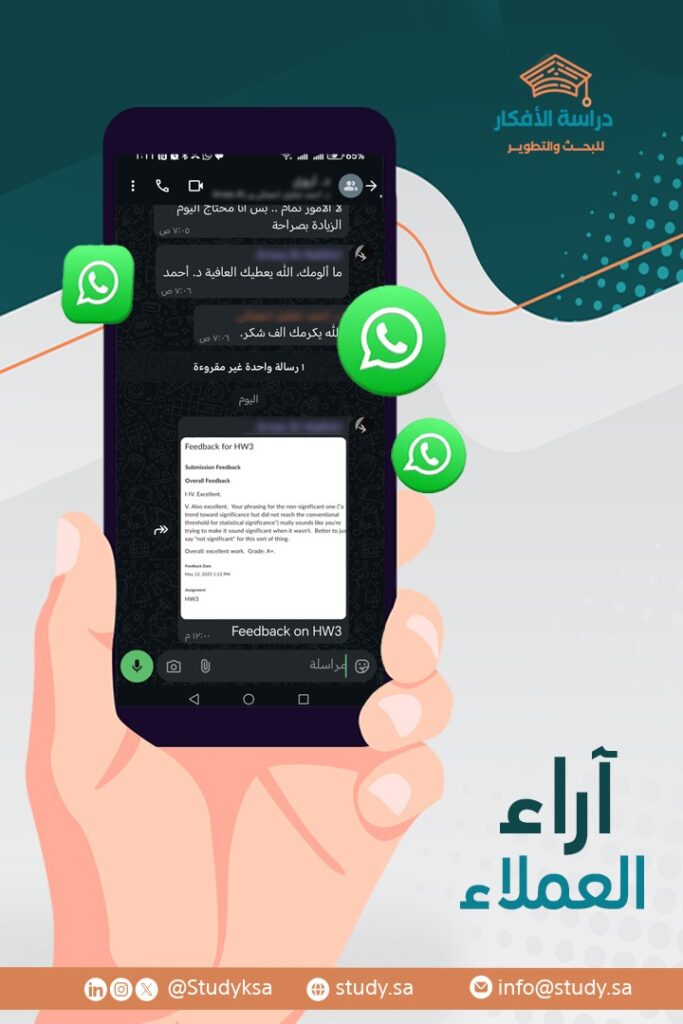
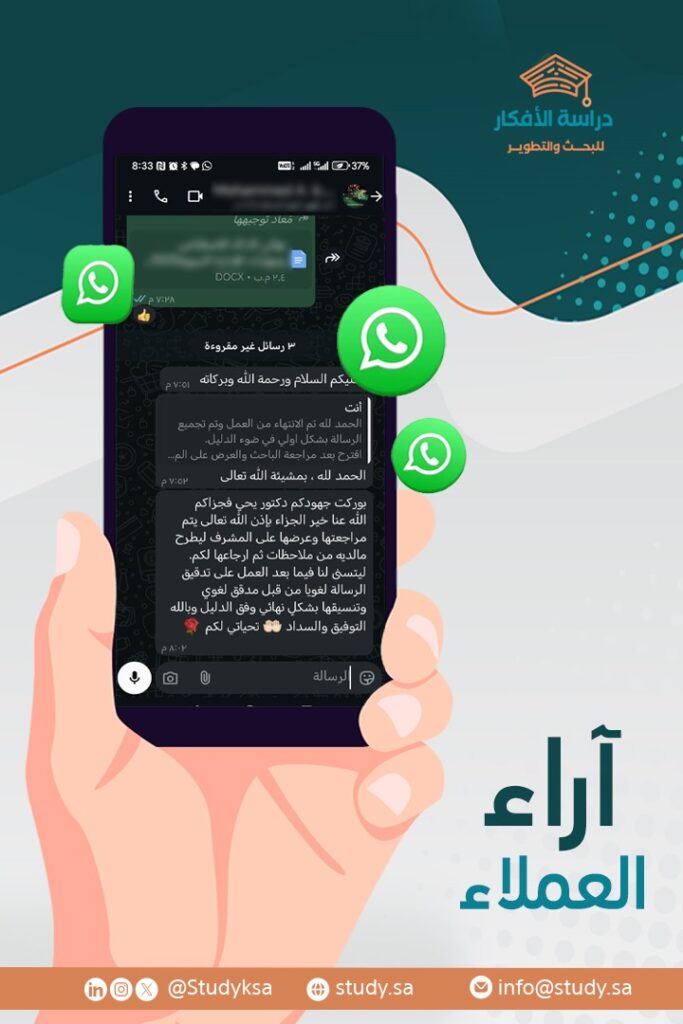
Researchers’ trust in our services did not come from nowhere, but from actual experience that has proven the professionalism and quality of what we offer in statistical analysis and writing results. Here are some of our clients’ opinions:

نفتخر بآرائكم – إنجاز يُقاس برضاكم ثقة العملاء هي أعظم إنجازاتنا – رأي عميل يعكس جودة العمل والاحترافية

About the Academic Team

The ‘Study Ideas for Research and Development’ team includes a select group of specialists in applied statistics and scientific research, holding Master’s and PhD degrees in various fields. The team has extensive experience in:

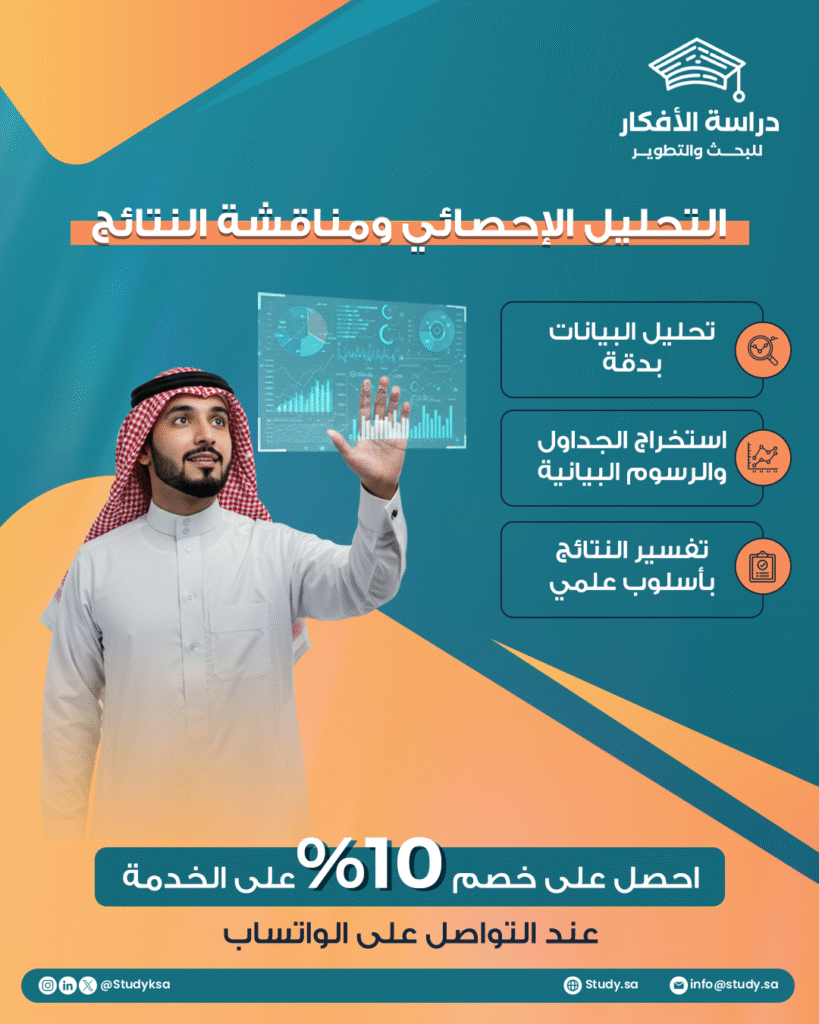
  1. Statistical analysis using SPSS and R software

  2. Writing T-Test, ANOVA, and regression results in APA style

  3. Precise understanding of the requirements of Saudi and Gulf universities

  4. Providing individual consultations to researchers in selecting appropriate statistical tools

We don’t offer ready-made services, but rather take the time to understand your research topic and provide suitable support that aligns with your methodology and specialization.

✳️ With us, you will get accurate results, professional writing, and continuous follow-up until your research is approved.

الموقع الأول في المملكة العربية السعودية للخدمات الأكاديمية

Conclusion

A T-Test is not just a statistical step in your scientific research, but a powerful tool that helps you verify your hypotheses scientifically and systematically. Using this test requires a precise understanding of its types, conditions, and how to interpret the results and link them to the study context. In this guide, we have explained when to use a T-Test, the differences between its types, how to apply it using SPSS, and how to write the results in an academically accepted APA format.

Whether you are conducting an analysis for a single sample, or comparing two independent or related groups, the T-Test remains one of the most important analyses in educational, psychological, administrative, and other human and applied fields.

✳️ Don’t let statistical analysis hinder your progress in your research.
Study Ideas for Research and Development Company places at your disposal a team of specialists to help you analyze your data, interpret the results, and write them with complete professionalism. Get reliable and fast academic support that meets your university’s requirements.

📞Contact us directly via WhatsApp

Comments

Explore Our Services
11111
Professional Jamovi Data Analysis Services for Students & Researchers
icon
Professional Jamovi Data Analysis Services for Students & Researchers
11111
خدمة تحليل البيانات باستخدام برنامج JASP
icon
خدمة تحليل البيانات باستخدام برنامج JASP
11111
خدمة التحليل الإحصائي النوعي
icon
خدمة التحليل الإحصائي النوعي
11111
خدمة التحليل المختلط بمنهجية Q
icon
خدمة التحليل المختلط بمنهجية Q
11111
خدمة التحليل الإحصائي بلغة R
icon
خدمة التحليل الإحصائي بلغة R
11111
خدمة التحليل الإحصائي ببرنامج E-Views
icon
خدمة التحليل الإحصائي ببرنامج E-Views
11111
خدمة التحليل الإحصائي المتقدم بـ AMOS
icon
خدمة التحليل الإحصائي المتقدم بـ AMOS
11111
خدمة تصور البيانات (Data Visualization) وإنشاء تقارير تفاعلية
icon
خدمة تصور البيانات (Data Visualization) وإنشاء تقارير تفاعلية
11111
خدمة تصميم العروض التقديمية للمناقشة
icon
خدمة تصميم العروض التقديمية للمناقشة
11111
خدمة الباحث المشارك (Co-Researcher Service)
icon
خدمة الباحث المشارك (Co-Researcher Service)
11111
خدمة عمل كتاب إلكتروني وفق المعايير الأكاديمية
icon
خدمة عمل كتاب إلكتروني وفق المعايير الأكاديمية
11111
خدمة كتابة ملخص البحث وترجمته للإنجليزية
icon
خدمة كتابة ملخص البحث وترجمته للإنجليزية
11111
خدمة تلخيص الكتب والمراجع العربية والإنجليزية
icon
خدمة تلخيص الكتب والمراجع العربية والإنجليزية
11111
خدمة تصميم البوسترات البحثية الاحترافية
icon
خدمة تصميم البوسترات البحثية الاحترافية
11111
خدمة ترشيح المجلات العلمية المحكمة
icon
خدمة ترشيح المجلات العلمية المحكمة
Get a free consultation from experts
whatsapp